English
There are several I+D teams working with gvSIG 3D in the scope of "España Virtual" project, a CENIT project supported by CDTI[1]. Their works are very interesting, and we were able to see some of them at last EV workshop. We asked them for permission to show what are they doing with gvSIG 3D. So we would like to thank to the following enterprises: Deimos[2], Indra[3] and Telefónica I+D[4]. In addition we'd like to thank to the following institutions and universities: Polytechnical University of Madrid(UPM)[5], the Institute of applied computing and community code(iac3)[6] from the University of the Balearic Islands.
The developments of this people are quite technical so forgive me in the case anything is not correct.
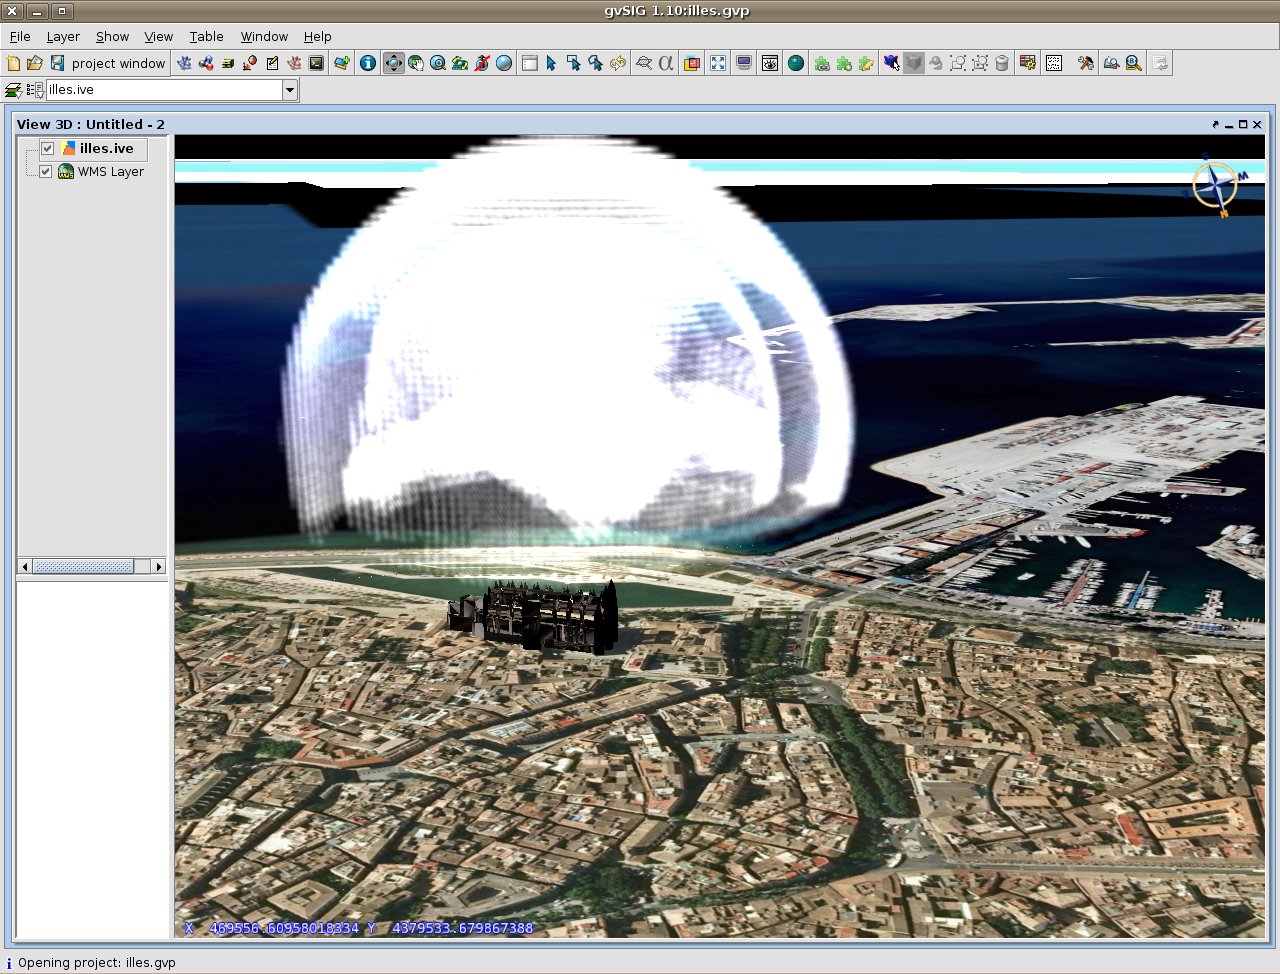
The first two images (from iac3) we show are related to 3D geovisualization of physicall phenomenon in a given time. We hope we can see this effects in 4D in the near future!
EspañolThere are several I+D teams working with gvSIG 3D in the scope of "España Virtual" project, a CENIT project supported by CDTI[1]. Their works are very interesting, and we were able to see some of them at last EV workshop. We asked them for permission to show what are they doing with gvSIG 3D. So we would like to thank to the following enterprises: Deimos[2], Indra[3] and Telefónica I+D[4]. In addition we'd like to thank to the following institutions and universities: Polytechnical University of Madrid(UPM)[5], the Institute of applied computing and community code(iac3)[6] from the University of the Balearic Islands.
The developments of this people are quite technical so forgive me in the case anything is not correct.
The first two images (from iac3) we show are related to 3D geovisualization of physicall phenomenon in a given time. We hope we can see this effects in 4D in the near future!
Hay varios equipos utilizando gvSIG 3D en el ámbito del proyecto España Virtual, un proyecto CENIT iniciativa del CDTI[1]. Sus trabajos son muy interesantes, y pudimos ver algunos de ellos el el último workshop de EV. Les hemos pedido permiso para enseñar en este blog lo que están haciendo con gvSIG 3D. Así que queremos agradecer a las empresas Deimos[2], Indra[3], y Telefónica I+D[4], y también a la Universidad Politécnica de Madrid(UPM)[5], al Institute of applied computing and community code (iac3)[6] de la Universitat de les Illes Balears que nos permitan mostrar estas imágenes.
Estos trabajos son muy técnicos, así que pido disculpas por adelantado si algo de lo escrito no es correcto.
Las primeras dos imágenes (cedidas por iac3) tienen que ver con la geovisualización tridimensional de fenómenos físicos. Esperamos poder ver estos efectos en 4D en un futuro cercano!

In the other hand Indra and UPM are working on building visualization and 3D visualization of athmospheric patterns related to air quality. They gave us this images. Every single 3D data is represented by a sphere, which color depends on the value of the data.
Por otro lado Indra y la UPM están trabajando en la representación tridimensional de edificios y la visualización de datos 3D producidos por modelos atmosféricos y de calidad del aire. En este caso cada dato 3D viene representado por una esfera, cuyo color varia dependiendo del valor del dato. Nos han dado permiso para mostrar estas imágenes:


[1]http://www.cdti.es
[2]http://www.deimos-space.com
[3]http://www.indracompany.com/
[4]http://www.tid.es/
[5]http://www.upm.es/
[6]http://www.iac3.eu/


No hay comentarios:
Publicar un comentario